If you’re on mobile and want to skip to the full map, tap here.
This map was a collaborative effort with Nick Parish over at Current Flow State. Nick reached out to me after seeing one of my previous ribbon maps and pitched the idea of doing one for the Deschutes River (Oregon), which would be more geared toward fishing/recreation and could potentially raise money for the Deschutes River Alliance. Though we initially spoke in spring 2025, I didn’t actually start working on the map in earnest until winter 2026. My wife and I were trying to move into and fix up our first house that summer and fall, so free time was a bit hard to come by. In the meantime, however, Nick tracked down a specific receipt printer and paper he thought we should try. Unlike the basic stuff I used for the Wakulla River and Boston Marathon receipt maps, Nick wanted to test a tougher, water-and-tear-resistant paper that the Oregon Fish and Wildlife service used to print their fishing licenses on. And whereas my printer only supported 180 dpi and paper rolls 3 inches wide, the Zebra GX420D we’d be using for this project could print on 4-inch rolls at 203 dpi. Such luxury! As far as the map design went, it was a similar process to the other ribbon maps I’ve done, so I’ll just hit on some of the highlights here and you can read those other posts if you want to know more about the particulars of ribbon and receipt maps. You can also read an interview I did with Nick for Current Flow State.
The biggest difference is that this map has basic shaded relief, which was a bit of challenge to include. While I considered showing terrain and elevation on those previous maps, it never made much sense. Two were in Florida, which is famously flat, and the other (Boston) was so packed and narrow that it simply wouldn’t fit (although I did use elevation data to show the uphill segments on the route). Terrain felt important for a map of the Deschutes, however, as it cuts a wide valley between countless canyons and gorges. The rub was that while I only needed vector data for the previous ribbon maps (points, lines, polygons)—shaded relief is typically derived from raster data. My workflow up until this point had been to gather up all my data into a GIS software, do a little processing and analysis where needed, and then bring it into Adobe Illustrator where I would manually cut, twist, and bend everything by hand (mouse). Doing that with a rasterized shaded relief image would’ve been practically impossible and left obvious smear marks—no matter how much time I might’ve put in with the smudge tool to mask the gaps left over from cuts and rotations. My other option—to vectorize the shaded relief into simple shapes first, then manipulate those—would’ve been nearly as difficult to work by hand as well as presented another problem:
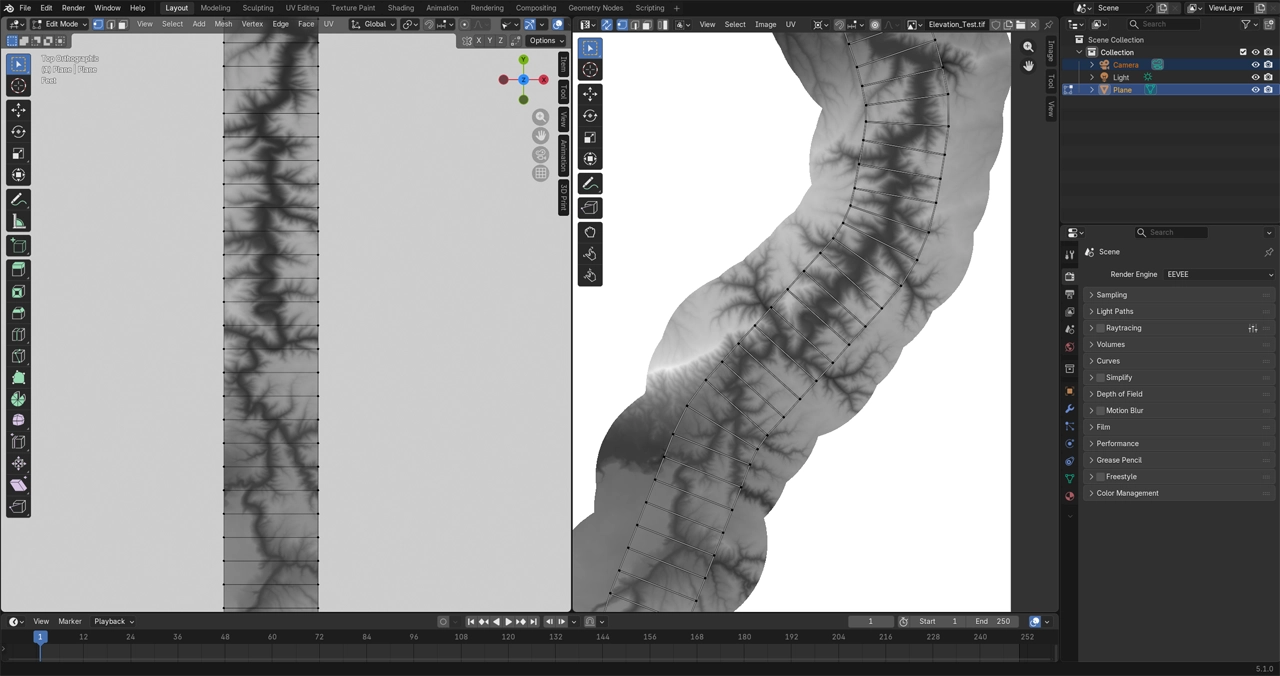
These ribbons maps have no consistent north direction. The orientation is shifting all along the map in order to keep the river relatively centered on the layout. Normally this is fine because the only directions we really care about are up-river and down-river. But when you do shaded relief, you have to pick a direction for your light source (typically northwest around 315°or 320°) to cast shadows from. If the map orientation changes all along the ribbon, those shadows will quickly stop making sense to your eye as it wanders down the paper. You’ll have shadows on faces pointing north (up) in some places and shadows on faces pointing south (down) in others. This would make it difficult to interpret the ridges from valleys—relief inversion to the extreme. To solve this, I needed to arrange my elevation data into my straightened layout first, then calculate the shaded relief, so that I’d have a consistent lighting angle throughout.
After some fiddling around, I came to a solution using Blender and UV maps. I first experimented with weird projections in Blender many years ago when I worked on my Apalachicola River table, where instead of straightening a river out, I swirled it into a spiral shape. I won’t go too deep on UV maps here (there are plenty of tutorials out there explaining what they are and how to use them), but their basic purpose is to map 2D textures to 3D objects. If you think of the classic orange peel map projection example, which demonstrates mapping a 3D sphere to a 2D plane, UV mapping is sort of the reverse process: how to take a 2D texture and cut it so that it can be wrapped around a 3D object. In this case, however, I’m mapping one 2D object to another 2D object with a different shape. The video below demonstrates this. In it, I’m using an outline of the river as a guide to position my UV map (right) and the resulting elevation data is warped to fit (left).
Once I completed this UV map, I could render out the projected image, send it over to GIS (ahoy, null island), and then calculate aspect data from it. In this case I only wanted a simple 3-tone relief, rather than a full hillshade. So, I classified the aspect data into three 60°segments covering 60° to 240° (picture 2 to 8 on a clock face) and colored each a different shade of grey. Once I had this UV map set up within Blender, I could then pass whatever other images I wanted into it (assuming they had the same aspect ratio as my elevation raster) and have them warped to match.
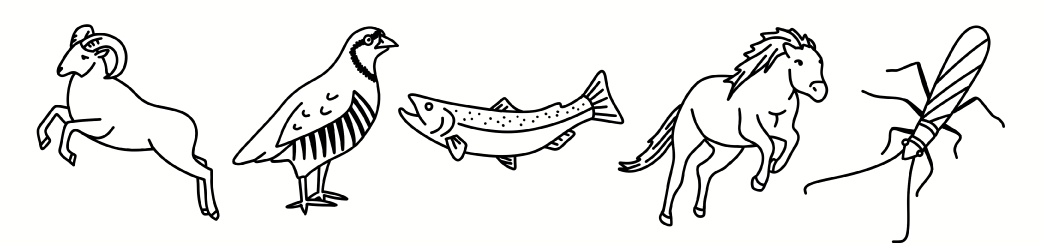
To bring in the campsites, for example, I exported out a raster image from my GIS software that used a simple black dot for each site. Then I passed that image through my Blender UV map, rendered it out, and sent it to Adobe Illustrator. In Illustrator, I could use the Image Trace functionality to re-vectorize those dots into objects. Lastly, using Nathaniel Kelso’s handy Find and Replace script, I could quickly replace all those objects with a custom tent symbol I made. Rinse and repeat for all the other points of interest.
Linear feature like roads and creeks were similar but needed some manual clean-up afterward. It helped to adjust the material settings in Blender to use a Color Ramp set to “Constant” in order to get a pure, 1-bit, black and white image as the output, with no shades of gray in between or any aliasing. This helps the Image Trace tool sus out the lines from the raster image and create nice vector paths. As far as I know, Blender doesn’t support using SVG files for textures, which is why I had to convert from vector to raster and back to vector again. Fingers crossed that in the future this workflow can be streamlined.
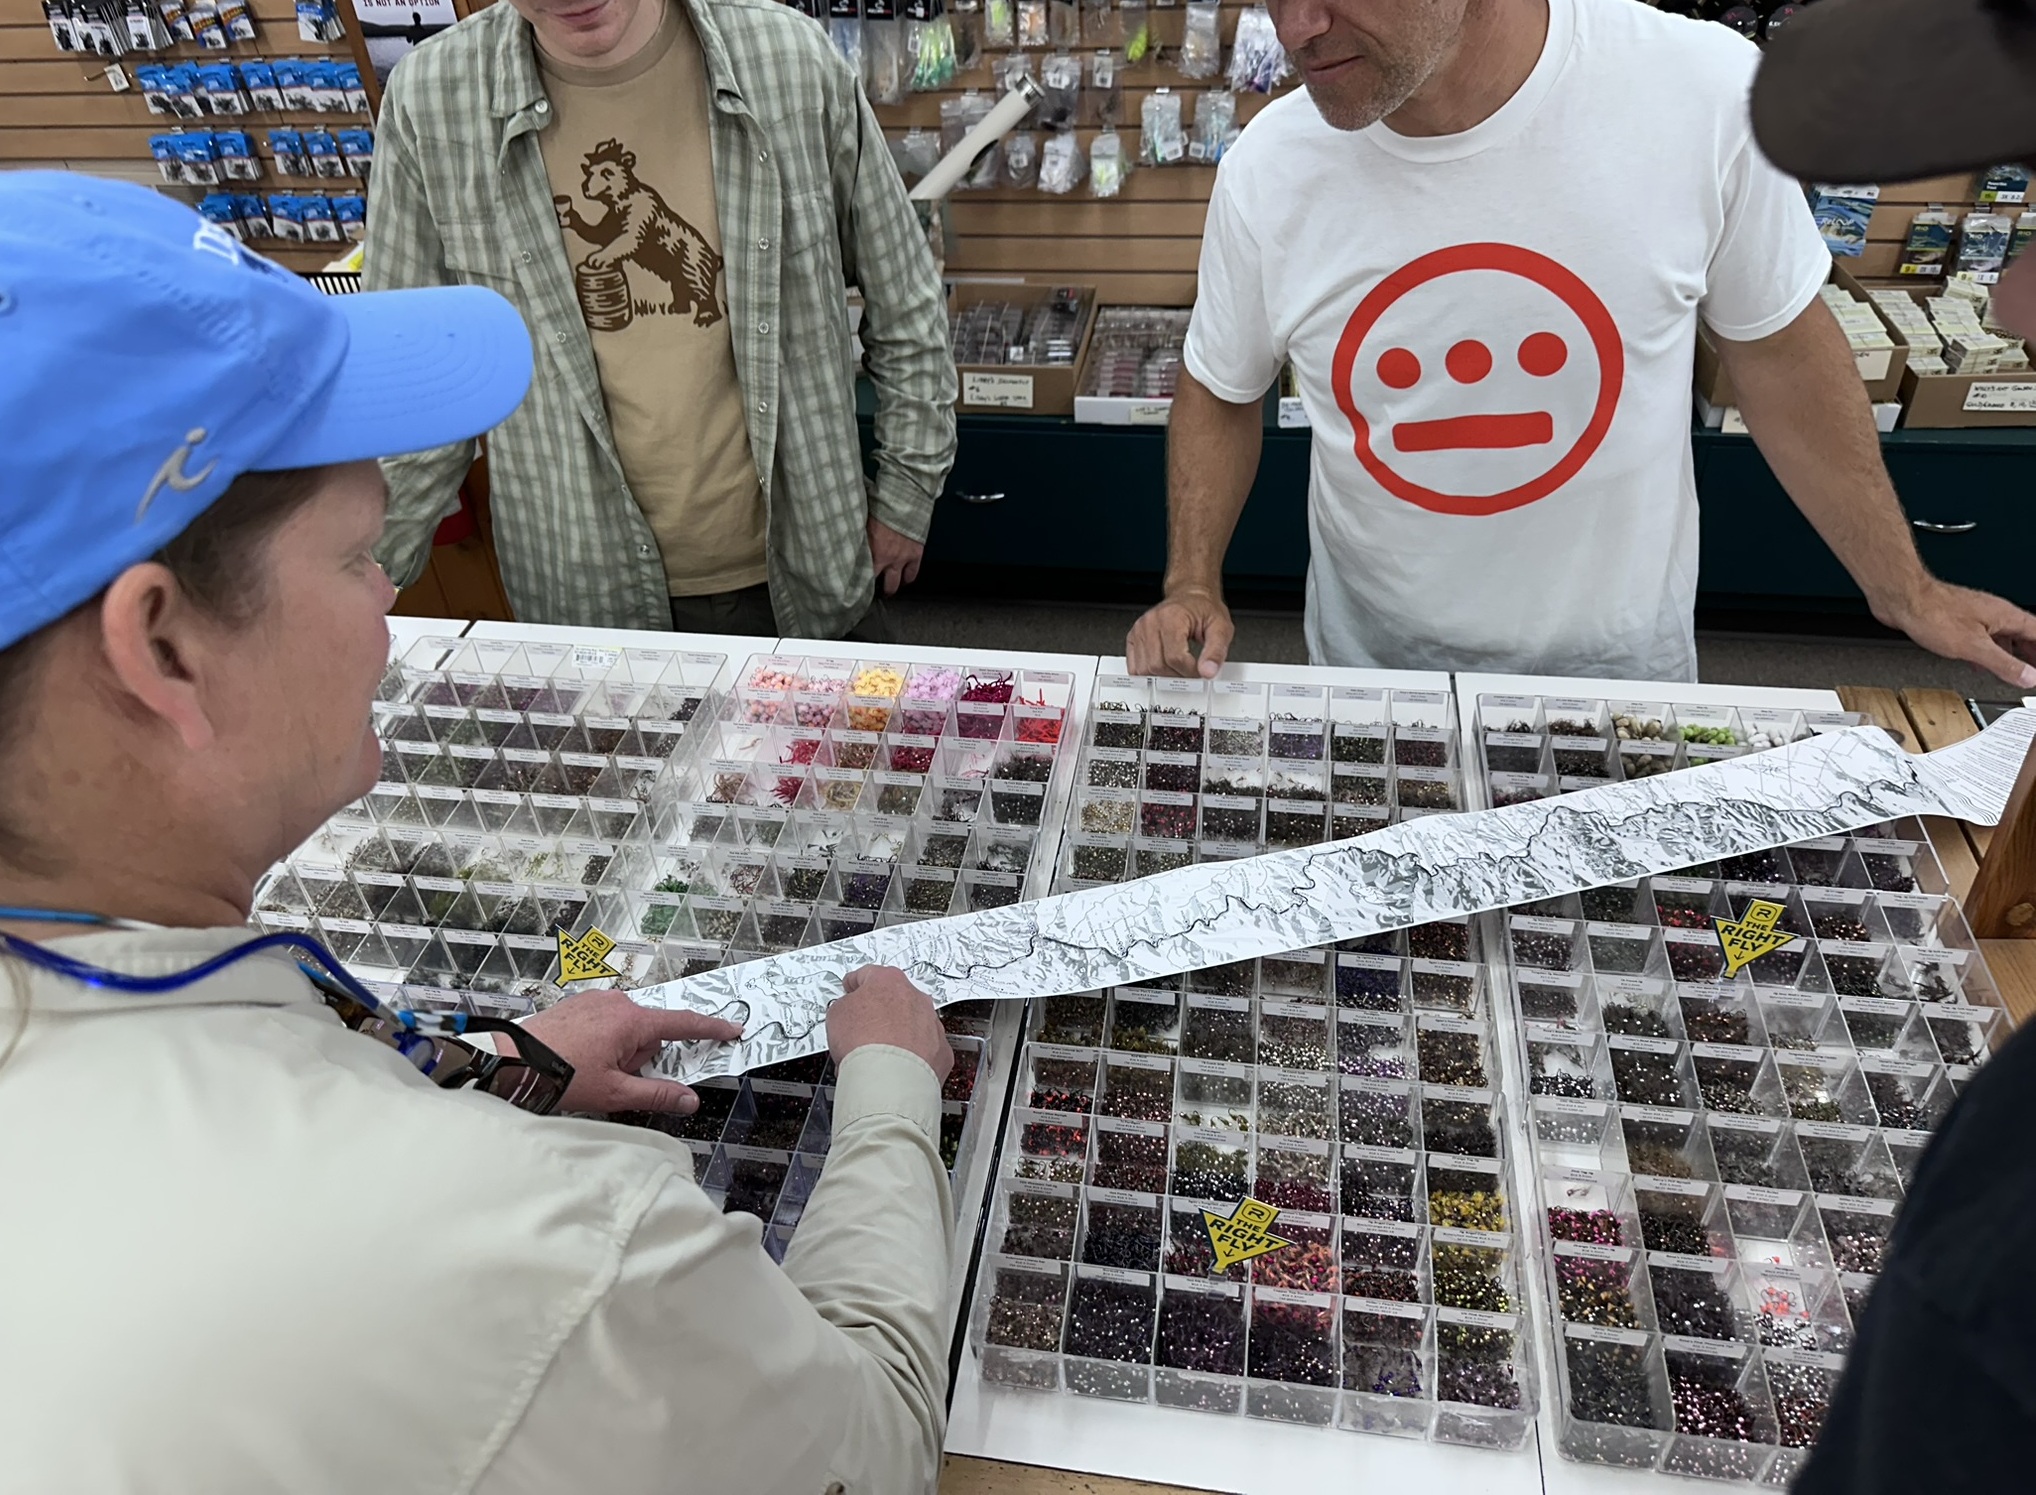
In the end, we did an initial print run of 400 maps. Nick got them distributed to various fly shops in the area and even brought some out to the 2026 Troutfest in Maupin, Oregon. Over 300 of them sold within just a couple of weeks, which is still hard for me to believe. If interested, you can order one for yourself at Current Flow State (assuming any are left). 100% of the money from all sales goes to support the mission of the Deschutes River Alliance, a non-profit (501c3) that seeks to protect and advocate for a healthier Deschutes River.